Ceftiofur is a third-generation cephalosporin antibiotic specifically used for animals. Common dosage forms include sodium ceftiofur for injection, ceftiofur hydrochloride injection, ceftiofur hydrochloride breast injection and ceftiofur crystal injection. Ceftiofur is mainly used clinically to treat bacterial respiratory infections in livestock and poultry. It has a broad-spectrum antibacterial effect on both Gram-positive and Gram-negative bacteria, including Pasteurella, Mannheimia, Actinomyces, Streptococcus, Haemophilus and Salmonella cholerae. It can be used to treat respiratory diseases in pigs and cattle, bovine mastitis, postpartum metritis, and bovine hoof rot. This experiment mainly studied the characteristics and applications of ceftiofur hydrochloride injection (Ceftiofur®) of Aimicogen (China) Biopharmaceutical Co., Ltd.
1. Structure and mechanism of action
Ceftiofur is a 7-aminocephalosporin nucleus that replaces the 7-β-aminoacyl group with an oxyiminothiazole group. The 3rd position of ceftiofur is furanoic acid thioester, making it a unique alternative to the third-generation cephalosporins. The main metabolite of ceftiofur, namely defuroyl ceftiofur, is the product of the hydrolysis of the thioester bond to release furanoic acid. The dimer of defuroyl ceftiofur (DFC) is the product of the condensation of DFC and itself, which retains the β-lactam ring and oxyimino-aminothiazolyl group of ceftiofur.
The mechanism of action of ceftiofur is the same as that of other β-lactam antibiotics. It can bind to penicillin-binding proteins (PBPs) on the bacterial cytoplasmic membrane, causing the loss of PBPs activity, hindering the cross-linking of mucins in sensitive bacteria, and causing cell wall defects. The high osmotic pressure in the bacteria causes the extracellular water to continuously penetrate into the bacteria, causing the bacteria to swell and deform, and activating autolytic enzymes, causing the bacteria to lyse and die, achieving the effect of efficient sterilization during the reproductive period.

2. Pharmacodynamics
After biotransformation in cattle and horses, ceftiofur is mainly metabolized by removing the furan carbonyl group on the third thio group to generate defurancarbonyl ceftiofur (DFC) with a complete β-lactam ring. Since the lactam ring is not destroyed, its antibacterial activity is basically the same as that of ceftiofur. Moreover, for respiratory bacteria, both ceftiofur and defurancarbonyl ceftiofur show good antibacterial activity against respiratory bacteria, and the MIC value does not exceed 0.3μg/mL.
Table 1. MIC Values of Ceftiofur Against Bovine Respiratory Pathogens
| Bacterial Species | MIC50 (µg/mL) | MIC90 (µg/mL) |
|---|---|---|
| Mannheimia haemolytica (n=48) | ≤0.0039 | ≤0.0039 |
| Desfuroylceftiofur | 0.0078 | 0.0078 |
| Pasteurella multocida (n=42) | 0.0078 | 0.0078 |
| Desfuroylceftiofur | 0.015 | 0.015 |
| Histophilus somni (n=59) | ≤0.0019 | ≤0.0019 |
| Desfuroylceftiofur | ≤0.0019 | ≤0.0019 |
| Staphylococcus aureus (n=10) | 1.0 | 1.0 |
| Desfuroylceftiofur | 4.0 | 8.0 |
| Streptococcus uberis (n=15) | 0.03 | 0.03 |
| Desfuroylceftiofur | 0.5 | 0.5 |
| Streptococcus agalactiae (n=15) | ≤0.0039 | ≤0.0039 |
| Desfuroylceftiofur | 0.015 | 0.015 |
After administration of ceftiofur, the metabolism in pigs is similar to that of cattle and horses, and defurancarbonyl ceftiofur is also the main antibacterial active drug, and the antibacterial activities of the two are similar. Ceftiofur shows extremely low drug resistance to pig respiratory bacteria, and the in vitro antibacterial activity is ≤0.125μg/mL. Actinobacillus pleuropneumoniae and Pasteurella show high sensitivity to ceftiofur.
Table 2. MIC Values of Ceftiofur Against Porcine Respiratory Pathogens
| Bacterial Species/Pig | MIC50 (µg/mL) | MIC90 (µg/mL) |
|---|---|---|
| Pasteurella multocida (n=50) | ||
| Ceftiofur | ≤0.0039 | ≤0.0039 |
| Desfuroylceftiofur | ≤0.0039 | 0.0078 |
| Actinobacillus pleuropneumoniae (n=50) | ||
| Ceftiofur | ≤0.0039 | ≤0.0078 |
| Desfuroylceftiofur | 0.0078 | 0.015 |
| Salmonella choleraesuis (n=48) | ||
| Ceftiofur | 0.5 | 1.0 |
| Desfuroylceftiofur | 0.25 | 1 |
| Streptococcus suis (n=49) | ||
| Ceftiofur | 0.0078 | 0.13 |
| Desfuroylceftiofur | 0.015 | 0.25 |
3. Pharmacokinetics
Whether the salt form of ceftiofur is administered intramuscularly or subcutaneously, the pharmacokinetic parameters (AUCs, etc.) of the two forms of the salt are statistically similar. The data show that both salt forms have similar therapeutic effects and systemic safety regardless of the route of administration. Similar equivalent therapeutic results were also observed in pigs, where two treatment levels of each salt (3.0 and 5.0 mg/kg) by the IM route gave essentially the same plasma concentrations, plasma concentrations (C max ), areas under the curve (AUCs), and elimination half-lives (t 1/2 ). Therefore, both salt forms are likely to produce the same therapeutic effects. In addition, for either salt, the residual concentrations in edible tissues should be the same regardless of the route of administration.
Table 4. Comparative Pharmacokinetics of Ceftiofur Hydrochloride and Ceftiofur Sodium After Single-Dose Administration in Cattle
| Parameter | Ceftiofur Hydrochloride | Ceftiofur Sodium |
|---|---|---|
| IM | SC | |
| Cmax (mg/mL) | 11.0 ± 1.69 | 8.56 ± 1.89 |
| Tmax (h) | 1-4 | 1-5 |
| AUC(0-∞) (mg·h/mL) | 160 ± 30.7 | 95.4 ± 17.8 |
| t1/2 (h) | 12.00 ± 2.63 | 11.50 ± 2.57 |
4. Safety
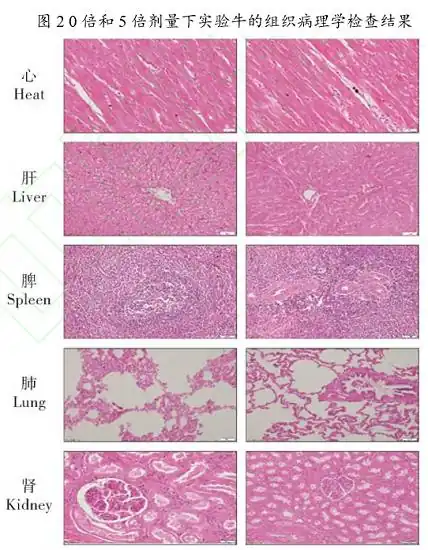
Ceftiofur hydrochloride injection was well tolerated after 9 consecutive days of administration at 1, 3, and 5 times the recommended dose for cattle. No significant changes related to ceftiofur were observed in clinical observations, clinical pathology, and histopathological examinations. Continuous administration had no effect on the feed intake, water intake and weight gain of all experimental cattle. In this study, the average body temperature of cattle in each group increased after the first administration and then stabilized. This shows that the experimental cattle developed tolerance to the drug and injection after the stress of administration. Body weight is a reflection of food consumption and normal growth. The results of the study showed that the drug had no effect on the normal growth of animals. The clinical pathological results did not show any trend of tissue or cell damage. Combined with the results of histopathological examination, there was no obvious pathological damage to the tissue at 5 times the recommended dose when used continuously. Therefore, ceftiofur hydrochloride injection has good safety in clinical use.
Table 5. Pre-experimental Bovine Hematological Analysis
| Parameter | 0x | 1x | 3x | 5x |
| Female | Male | Female | Male | |
| WBC | 9.71±1.70 | 7.89±1.19 | 8.44±1.29 | 8.27±0.95 |
| LYM | 5.77±0.58 | 4.74±1.08 | 5.61±0.90 | 4.89±0.24 |
| MON | 0.57±0.13 | 0.39±0.13 | 0.44±0.12 | 0.44±0.24 |
| NEU | 3.28±1.06 | 2.68±0.57 | 2.31±0.68 | 2.87±2.00 |
| EOS | 0.08±0.04 | 0.07±0.03 | 0.07±0.03 | 0.05±0.02 |
| BAS | 0.03±0.02 | 0.06±0.09 | 0.02±0.01 | 0.02±0.01 |
| RBC | 9.15±0.46 | 241.91±465.39 | 9.72±0.70 | 10.15±0.20 |
| HGB | 9.80±0.55 | 9.70±0.56 | 10.40±0.58 | 10.45±0.62 |
| HCT | 35.78±0.96 | 36.18±2.70 | 38.58±1.82 | 37.30±2.77 |
| MCV | 39.50±1.30 | 39.00±0.82 | 39.75±2.63 | 36.75±3.10 |
| MCH | 10.73±0.66 | 10.50±0.29 | 10.73±0.51 | 10.33±0.66 |
| CHC | 27.40±1.01 | 26.80±0.38 | 27.00±0.80 | 28.10±0.88 |
| PLT | 227.75±45.99 | 219.75±38.77 | 219.25±37.21 | 294.25±20.45 |
| MPV | 5.90±0.27 | 5.65±0.31 | 5.78±0.22 | 5.85±0.39 |
| PCT | 0.14±0.03 | 0.13±0.03 | 0.13±0.03 | 0.17±0.01 |
Terminology:
WBC: White Blood Cell
LYM: Lymphocyte
MON: Monocyte
NEU: Neutrophil
EOS: Eosinophil
BAS: Basophil
RBC: Red Blood Cell
HGB: Hemoglobin
HCT: Hematocrit
MCV: Mean Corpuscular Volume
MCH: Mean Corpuscular Hemoglobin
CHC: Mean Corpuscular Hemoglobin Concentration
PLT: Platelet
MPV: Mean Platelet Volume
PCT: Plateletcrit
Table 6. Post-experimental Bovine Serum Biochemical Analysis
| Parameter | 0x | 1x | 3x | 5x |
| Female | Male | Female | Male | |
| WBC | 8.73±2.60 | 7.38±1.35 | 8.14±1.71 | 7.15±0.46 |
| LYM | 5.93±0.91 | 4.73±1.23 | 4.96±1.21 | 4.40±0.62 |
| MON | 0.46±0.21 | 0.50±0.10 | 0.37±0.23 | 0.38±0.25 |
| NEU | 2.22±1.48 | 2.11±0.64 | 2.57±0.47 | 2.21±0.79 |
| EOS | 0.09±0.03 | 0.09±0.03 | 0.19±0.11 | 0.12±0.03 |
| BAS | 0.03±0.02 | 0.02±0.01 | 0.05±0.03 | 0.04±0.01 |
| RBC | 9.46±0.61 | 9.83±1.06 | 9.76±0.65 | 10.08±0.68 |
| HGB | 10.28±1.13 | 10.78±1.33 | 10.63±1.02 | 10.53±0.51 |
| HCT | 35.97±2.90 | 37.15±3.21 | 38.92±3.88 | 36.64±3.11 |
| MCV | 38.00±1.63 | 38.00±1.41 | 40.00±2.00 | 36.25±1.89 |
| MCH | 10.90±0.80 | 10.93±0.40 | 10.85±0.64 | 10.45±0.54 |
| CHC | 28.60±1.51 | 28.85±1.52 | 27.35±0.90 | 28.83±1.20 |
| RDWc | 24.98±1.89 | 24.80±0.68 | 25.53±0.70 | 24.60±2.47 |
| RDWs | 38.88±3.45 | 38.28±1.42 | 41.43±2.22 | 36.15±2.14 |
| PLT | 218.25±61.05 | 207.50±30.39 | 203.00±32.62 | 247.75±36.35 |
| MPV | 5.95±0.24 | 5.88±0.50 | 5.93±0.26 | 5.98±0.41 |
| PCT | 0.13±0.04 | 0.12±0.02 | 0.12±0.02 | 0.14±0.01 |
| PDWc | 30.75±1.90 | 30.30±2.40 | 30.50±2.34 | 30.63±2.61 |
| PDWs | 8.38±1.13 | 8.15±1.50 | 8.38±1.12 | 8.35±1.59 |
Figure: Histopathological Examination Results of Experimental Cattle at 0x and 5x Doses


Comments are closed.